The International Diabetes Center has produced a great resource breaking down the ambulatory glucose profile for self monitoring of blood glucose (SMBG), continuous glucose monitoring (CGM), insulin pump and CGM, and closed loop pump and CGM. Below are a list of components of this profile.
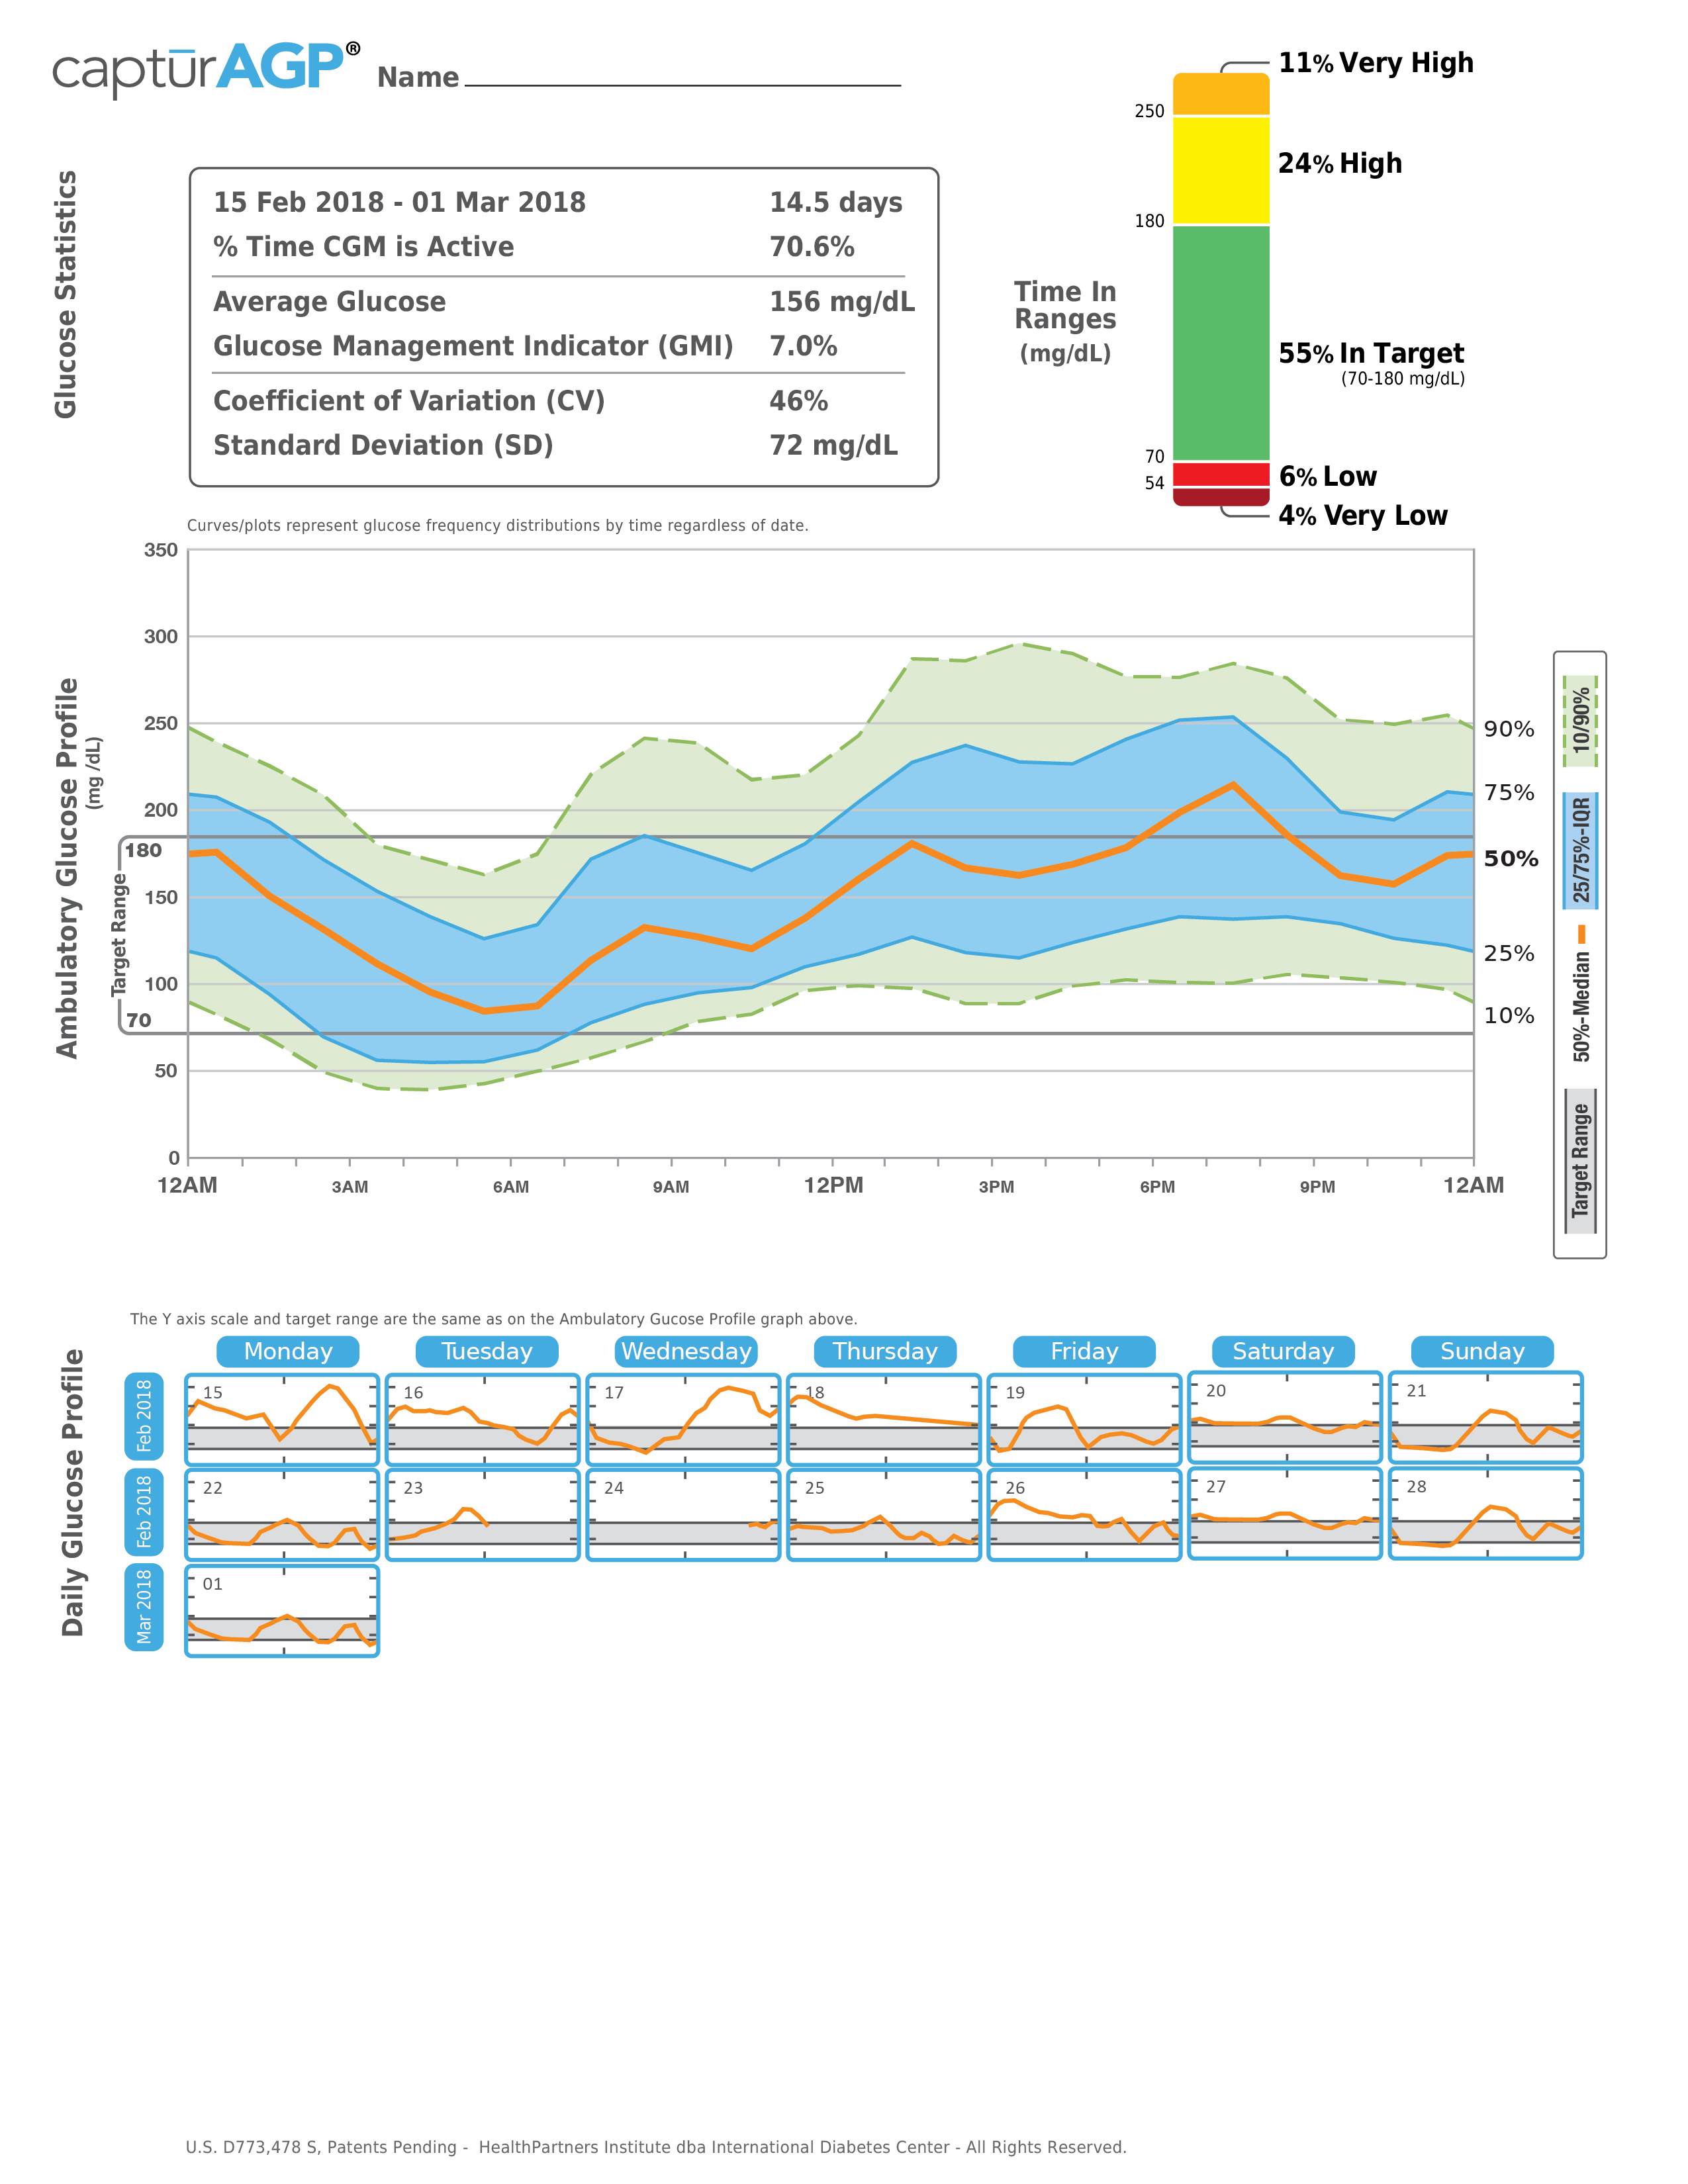
Glucose statistics: average tests per day (SMBG ), percent time CGM active, average glucose (mean), GMI (glucose management indicator), CV (coefficient of variation), SD (standard deviation)
Time in range: time in target, low/very low, high/very high
Glucose profile: 24 hour picture of glucose; orange, blue and green zones
Daily glucose profile (SMBG and CGM): single day’s glucose pattern is represented in a box
Bolus insulin graph (pump and CGM, and closed loop pump and CGM): one graph of 24 hour insulin bolus doses
Insulin profile graph ( pump and CGM, and closed loop pump and CGM): shows basal insulin pump settings over 24 hour period
Below is a link with more detailed look at the AGP.
http://www.agpreport.org/agp/agpreports#CGM_AGP

Please share your thoughts and subscribe to receive my blogs.
#ambulatory #glucose #profile
Follow me on Twitter and Facebook @ReecesPiecesDi and Instagram ReecesPiecesDI.